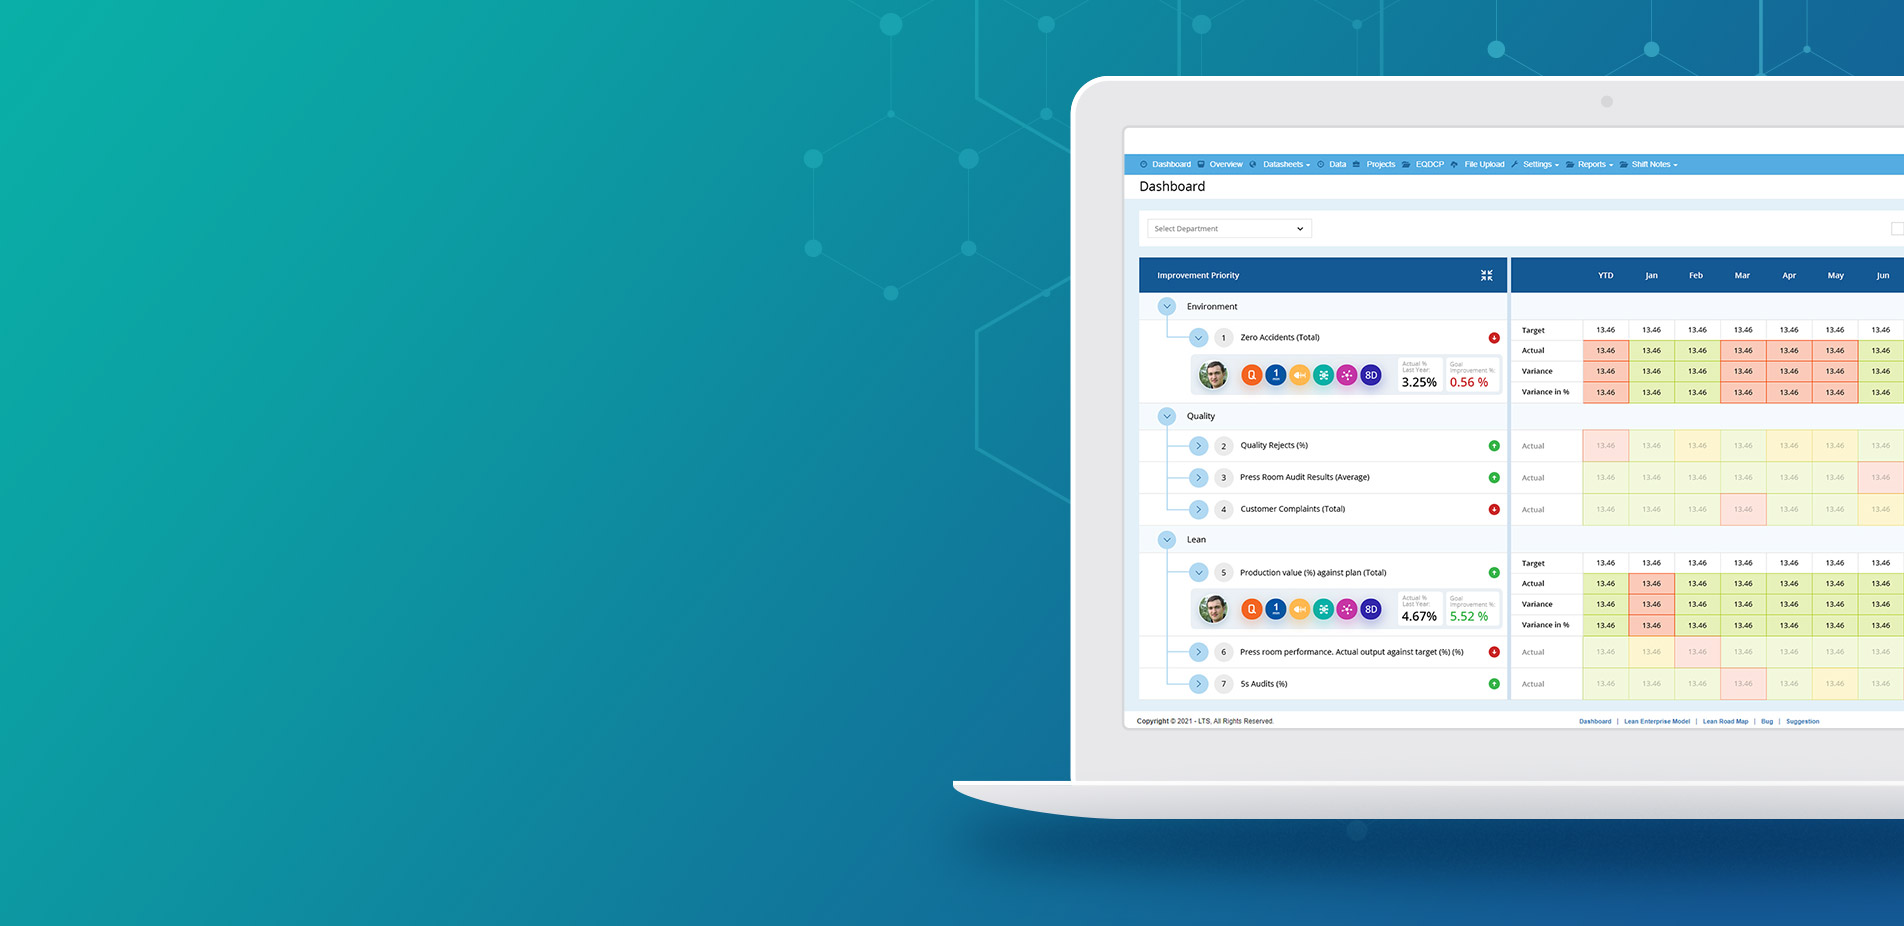
Data Point: Computerised Balanced Scorecard
- Reports on Health and Safety, Sales, Quality, Delivery, Cost, People, Maintenance and Environment
- Better Strategy Map Visualisation
- Supports your Business Framework
- KPI Metrics and Visual Management Board
- Communicate Organisation Strategy to All Employees
- Align Departments and Division Goals
- Clarity of Purpose
- Track and Assess Individual, Departmental and Organisational KPIs

Data Point: Computerised Balanced Scorecard
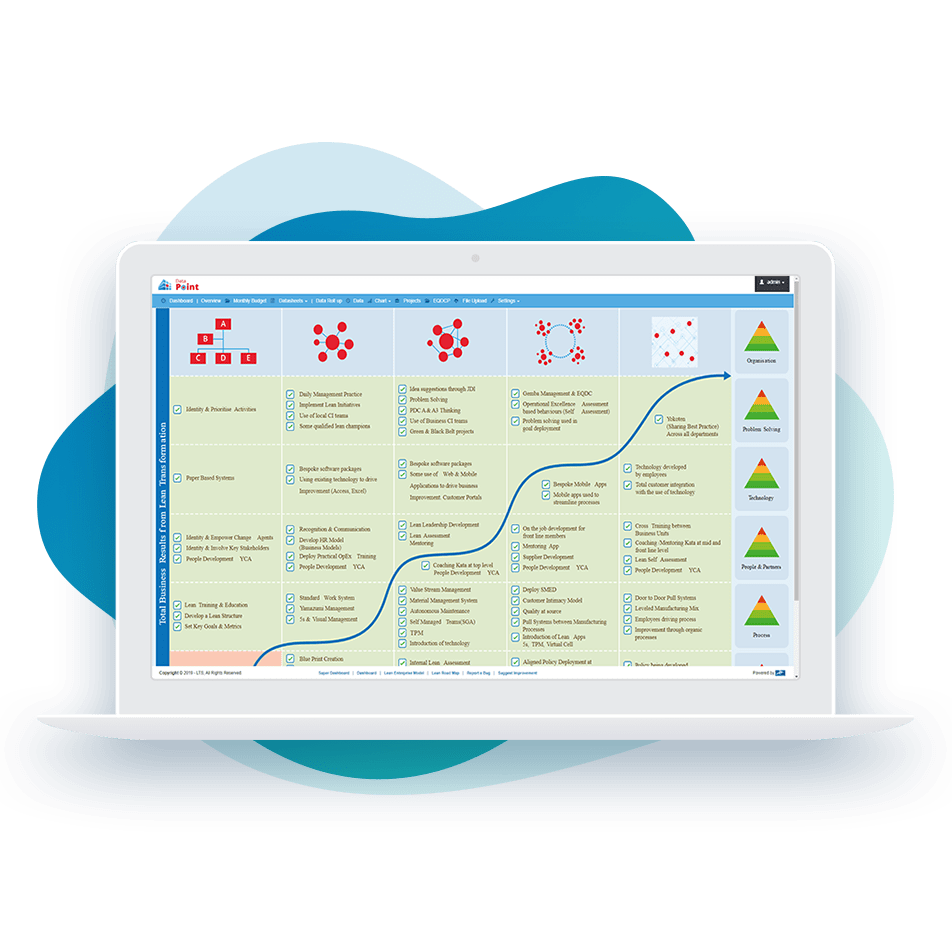
Better Strategy Management
- Strategy Map
- Strategy Communication
- Data Extraction
- Strategy Visualisation
Balanced Scorecards are used as a strategy execution tool, but Data Point is more than a dynamic balanced scorecard software. Data Point considers scorecards and KPIs more than just data. Our system visualises the complete business story of your organisational strategies and helps you to easily identify where you are with your strategy execution. Our scorecard software enables organisations to monitor and manage performance metrics and strategy implementation to achieve future goals. It puts your strategy map, performance measures, related initiatives, and other dashboards at your employee’s fingertips. It automates the reporting process and eliminates all the complex spreadsheet maintenance needed for data normalisation and composite index creation.
- Strategy Map Visualisation
- Easy Strategy Communication
- Performance Metrics
- Customisable KPI Metrics
- Department Dashboards
- Web-Based Solution with Global Accessibility
- Onsite Implementation and Training Support
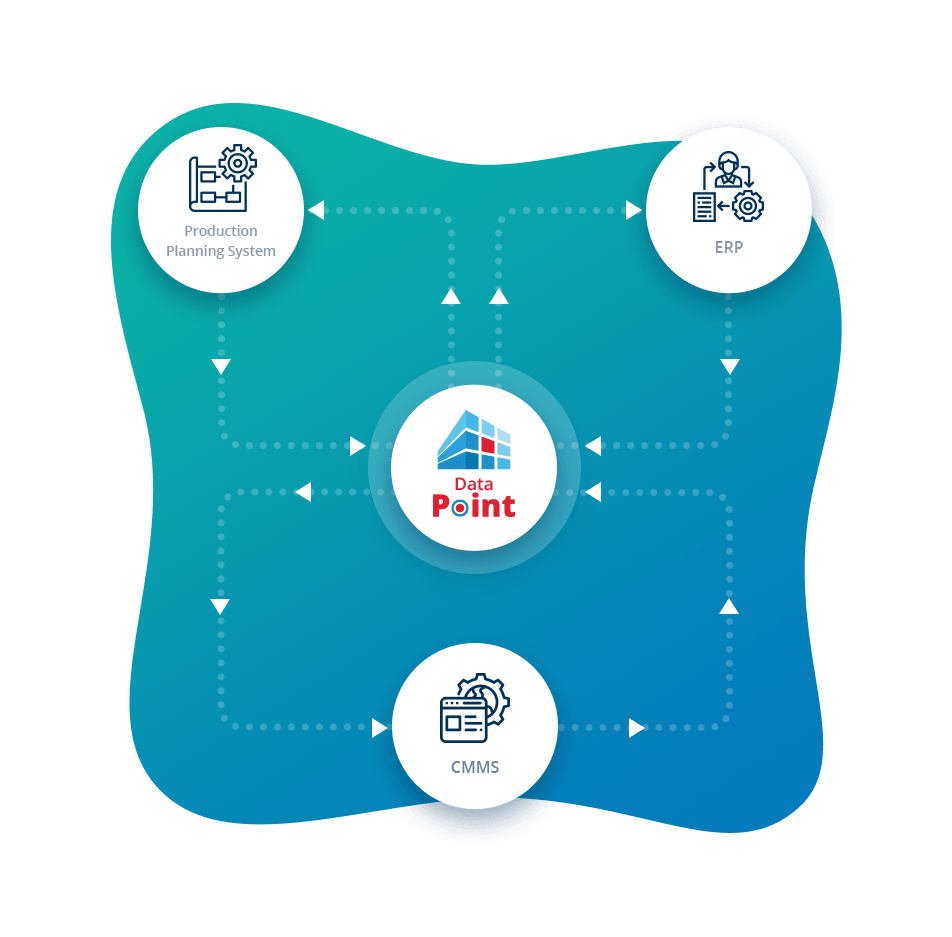
Data Synchronisation and MIS Integration
- Integrated Communication
- Automation
- Single Sign-In
- Data Consistency
- Rest API
Data Point system is so dynamic to integrate with the other management information and ERP systems in the organisation. Data Point system receives all the departmental data from ERP system automatically using the REST API service. Also, the system can be integrated with all the other information systems such as Production Management Systems, Quality System, Maintenance Management System and many more. Our system performs data synchronisation in real time which helps you to have a look at your live organisation performance.
- No Data Redundancy
- Increased Flexibility and Process Efficiency
- Centralised and Accessible Information
- Saves Data Entry Time of Employees
- Comprehensive Process Visibility and Integrated Operation
- Simplified IT Administration
- Cost and Storage-Saving
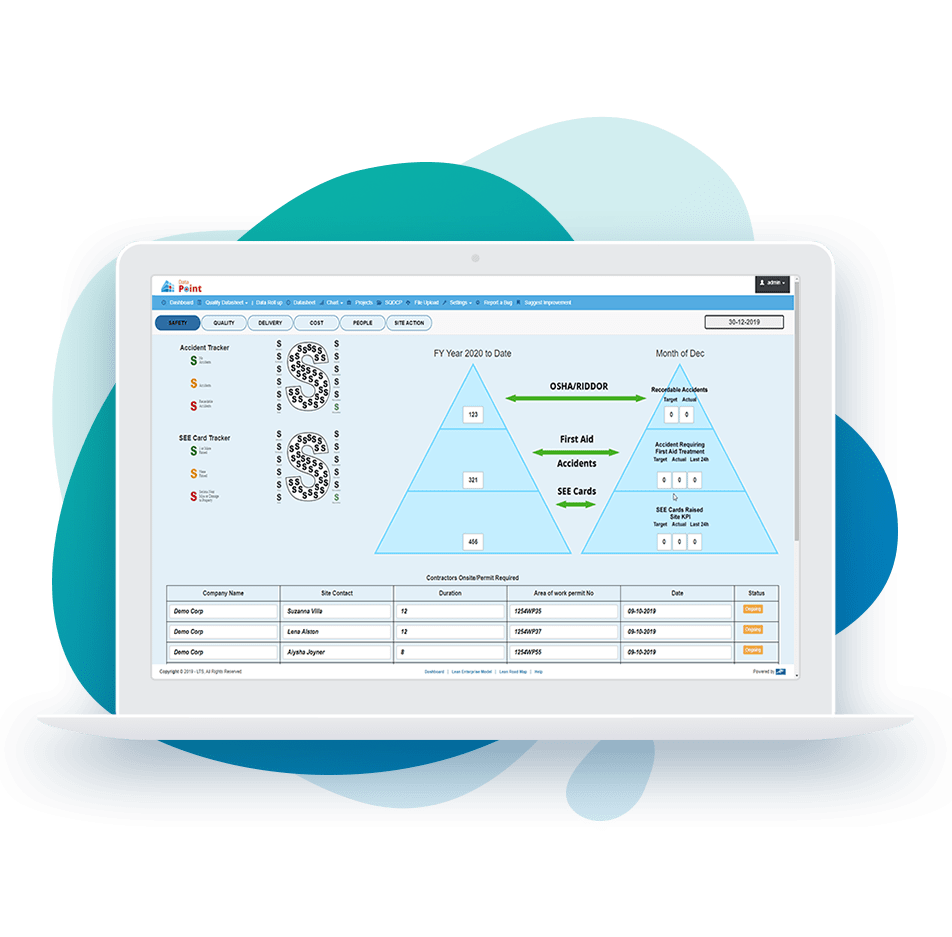
Safety Metrics
- Track Accidents
- Near Miss Reports
- RIDDOR
- Onsite Emergency
Data Point helps to track accidents and records the serious near-miss happened onsite. The system receives this information from your safety systems or any other systems used to capture the shop floor safety activities. Health and safety records can be generated periodically. Data Point analyses this data and gives you a clear idea about the safety measures and to identify areas that require more attention.
- Assessment of Accidents, Injuries and Illness
- Promoting a Safety Culture in the Workplace
- Reduce the Risk Factor
- Helps to Understand Work Conditions that Pose Unhealthy or Dangerous Situations
- Analyse Health and Safety KPIs
- Helps to Make Decisions to Prevent Accidents and Save Resources
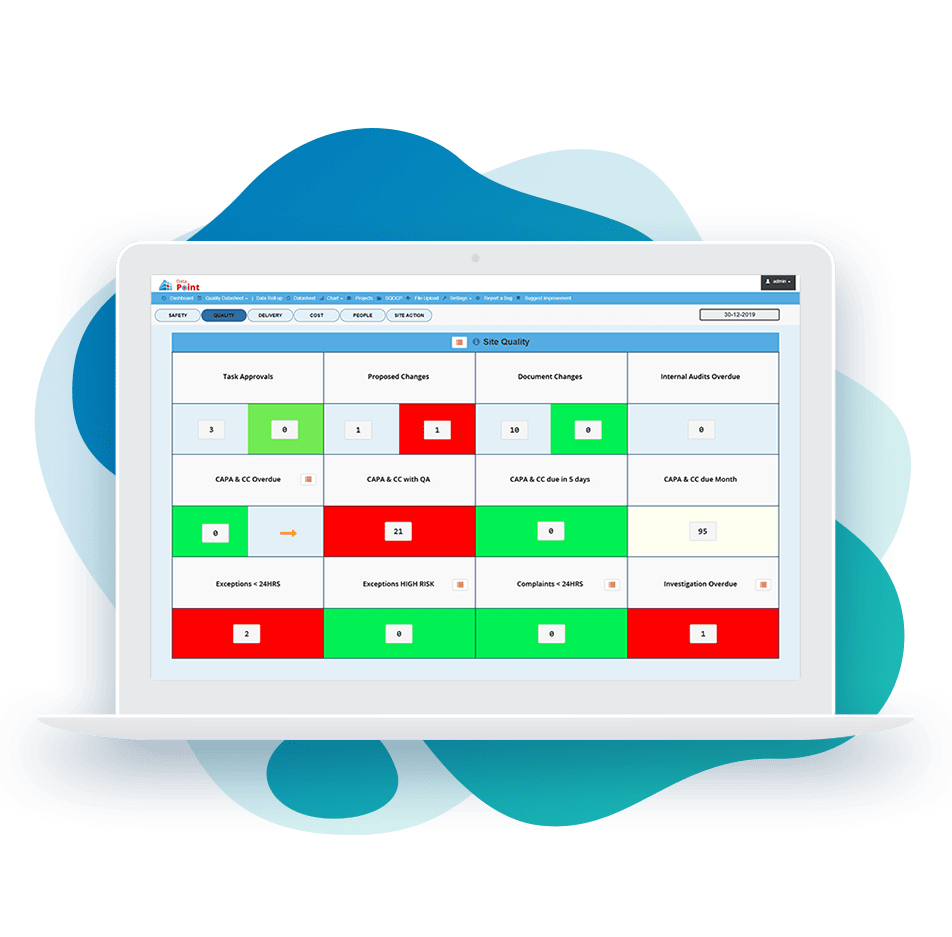
Maintain Quality
- Internal Audits
- Corrective Action Preventive Action(CAPA)
- Investigation Reports
Quality metrics in Data Point helps the organisations to measure the defect level of incoming products as perceived and measured by the customer. Quality could also measure, on-time delivery, the accuracy of the organisation’s delivery forecasts. The combination of performance and service measures how the organisation’s products or services contribute to creating value for its customers. With the quality metrics, organisations can manage the quality task, register a complaint, make necessary corrective or preventive actions and report regarding the internal audits and investigation.
- Improve Corrective Action Preventive Action (CAPA)
- Saves Internal Quality Auditing Time
- Quality Complaint Management
- Quality Document Revisions and Versions Management
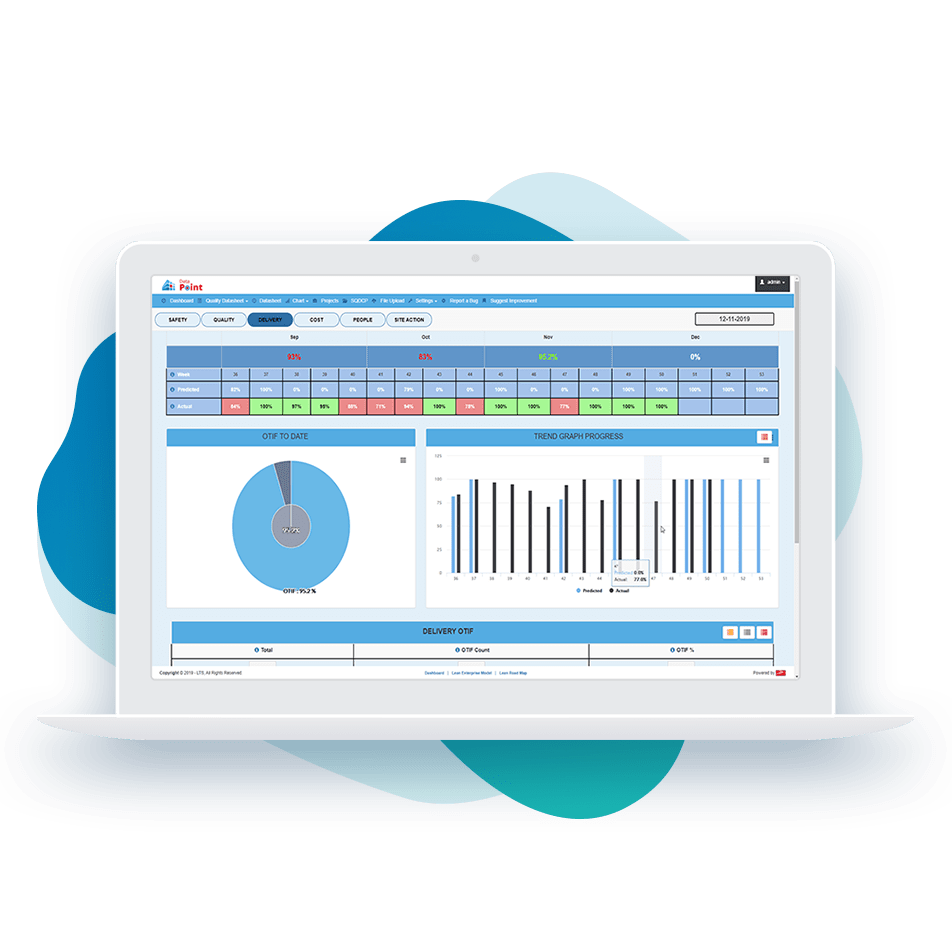
Ensure On-Time Delivery
- Warehouse KPIs
- Delivery OTIF
- Value of Production(VOP)
- Variance Charts
- Planned vs Actual Reports
Data Point monitors all the delivery processes from suppliers to customers. All the warehouse processes and stock moves are analysed and the system gives the appropriate data to the management team. From delivery metrics, organisations can see the reports on Quality, Production, Warehouse, Delivery OTIF(on-time and in-full) and Value of Production (VOP). Organisations can see the reports in several formats including Pie charts, Bar Charts, Line Charts, and Pareto Charts.
- Quality Reports on Goods-In, Goods in Production and Goods Despatch
- Production Performance
- Monthly OTIF and Trend Chart
- Warehouse Reports on Goods in, Goods out and Reject
- Reports on VOP Variance
- Delivery Cost-Savings Charts
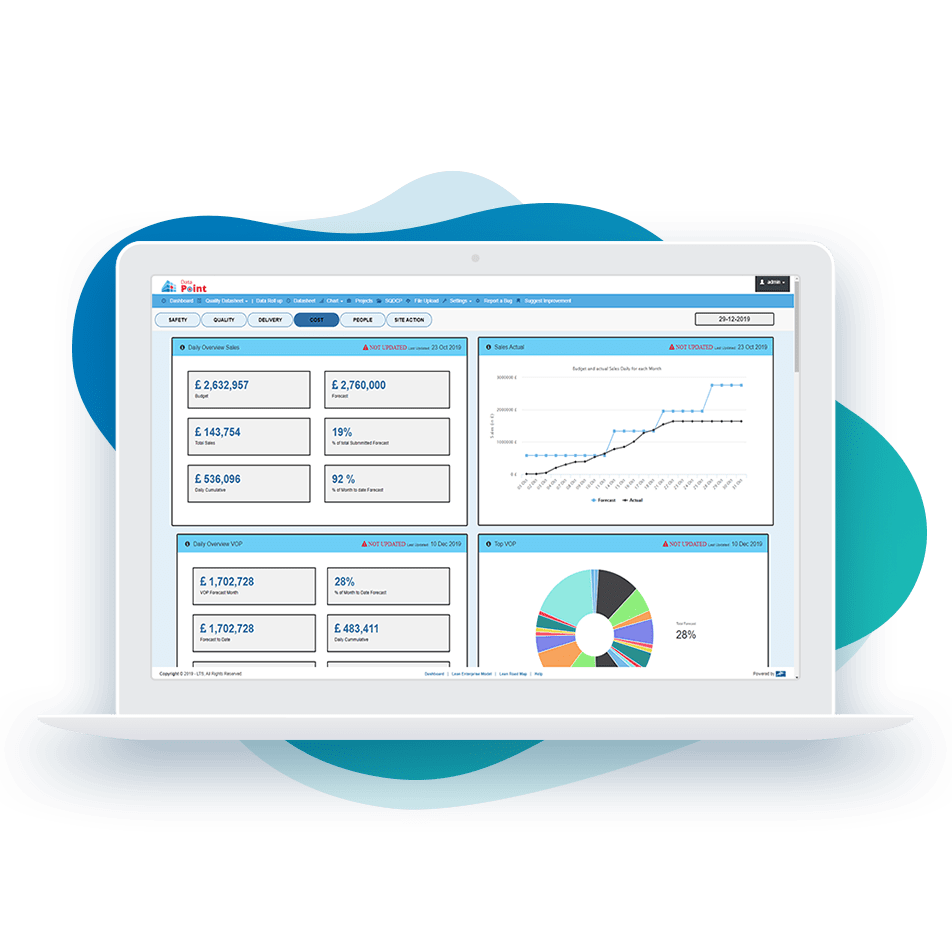
Financial Control
- Monitor Budget
- Forecast Sales Revenue
- Forecast Budget
- Forecasted vs Actual Financial Status
- Cost-Effective Objectives
Financial goals and objectives are one of the most important and sensitive metrics for an organisation. Data Point manages the financial objectives very intelligently by analysing the organisation's financial figures. With the support of our system organisations can plan and implement many financial objectives to improve the business’ financial health. The system gives you comprehensive insights on Profits Margins, Revenue Sources, Supplier Driven Costs, Cost saving objectives and Cost-efficient business process. Using AI technology Data Point shows the future revenue and cost trends. From the available data and predictions, organisations can easily plan their periodical budgets.
- Manages Financial KPIs
- Financial Budgeting
- Reports Revenue Source
- Reports on Daily overview VOP and VOP Variance
- Revenue Forecast
- Track Production and Process Costs
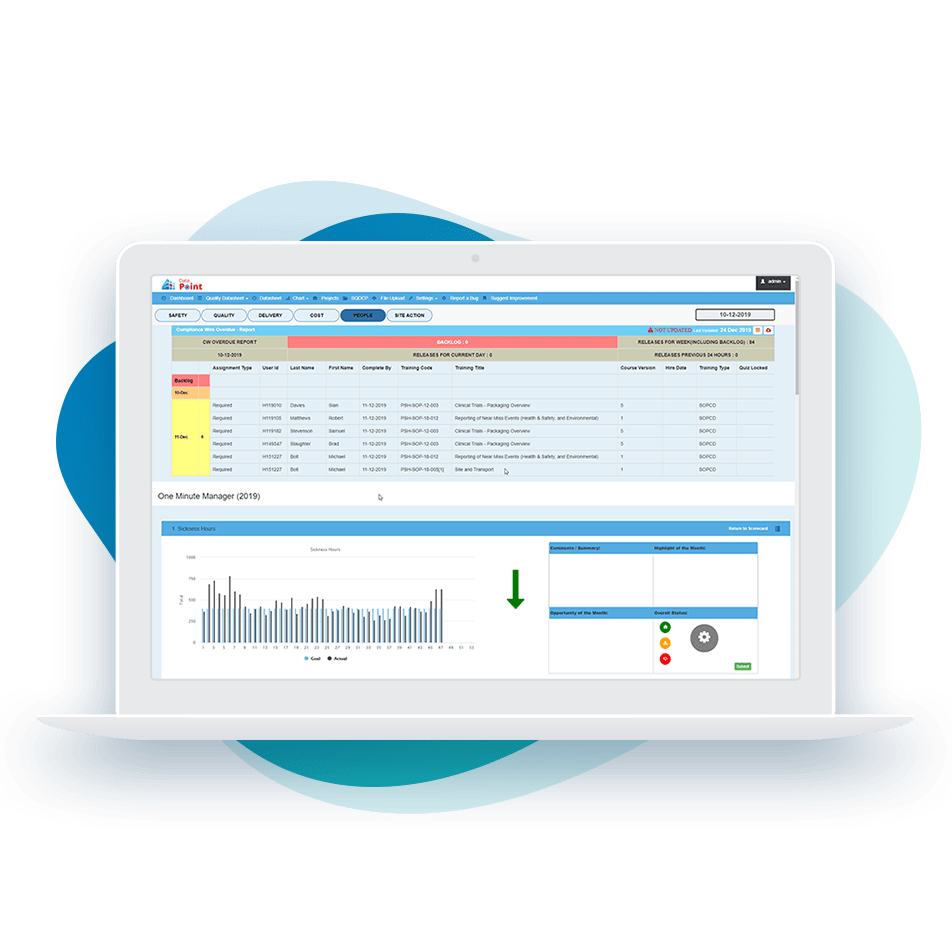
People
- People KPIs
- Learning
- Growth
- Organisation Culture
The people metrics in Data Point measures how good are people in their job roles. Using the dynamic scorecard system organisations can assess their professional skills, training effectiveness, employee’s knowledge about the organisational culture, teamwork and employee alignment. Data Point analyses this qualitative information and tells how people are creating value in the business. This is a great tool to measure human resource strategies.
- Measure Employee Performance
- Employee Development Plans
- Learning and Growth
- Skills Assessments
- Information Capital Assessments
- Measure Productive Hours